
If you’re running a specific promotion campaign that sends people to your website, you should add campaign parameters, called UTM parameters, to your links to track how well they perform.
There’s no setup needed in Google Analytics, you just need to add these UTM parameters to the URL you place in your marketing materials.
When you add the link to your blog post, social media post, email blast, etc, simply add the parameters to the end of the URL. Then, you will see click, conversion, and other performance metrics tracked in Google Analytics, under Acquisitions > Campaigns.
Required & Optional UTM Parameters
There are 3 required parameters and 2 optional parameters. These are case-sensitive, so it’s best practice to always use lowercase letters and to use dashes instead of spaces.
utm_source: Who or what is sending traffic to your website? Is it ‘google’, ‘facebook’, a link in a ‘pdf’?
utm_medium: How is the source sending that traffic? Via a ‘social’ post, an ‘email’ blast, or a paid ‘cpc’ ad on search results pages?
utm_campaign: What are you calling this campaign? Is it ‘spilled-ink’, ‘summer-trunk-shows’, or ‘the-great-mark-twain-marketing-training’? (Note that it should be all lowercase and dashes instead of spaces).
utm_term: If this is a paid search ad, then you can note which keyword triggered this ad.
utm_content: You can get more specific about which link to credit in a piece of content with multiple links to the same page. For an email blast, for example, it could be ’banner-link’, ‘footer-button’, or ‘in-copy-link’.
Example: Adding Analytics UTM Parameters
Let’s say you are promoting a retail event at your store, Business, Ink. The campaign is for a sale called “Spilled Ink” and has several channels sending traffic to a specific landing page on your website, https://www.business-ink.com/spilled-ink. You are offering a discount for people that buy using a form on that page.
You have paid social media ads running, an email campaign, and ads on Google.
To measure their effectiveness in a campaign you’d:
.url { border-color:white; border-radius:5px; background:black; border-top:10px; padding:5px 15px 5px 15px; border-radius:5px; } .step-header{ } .url-header{ }
Start with the base URL followed by a query parameter, or ‘?’: |
| https://www.business-ink.com/spilled-ink? |
Next you’d add a source parameter to each of your different channels followed by an ampersand, or ‘&’ |
| https://www.business-ink.com/spilled-ink?utm_source=facebook& |
| https://www.business-ink.com/spilled-ink?utm_source=mailchimp& |
| https://www.business-ink.com/spilled-ink?utm_source=google& |
Add your medium parameter followed by another ampersand, or ‘&’: |
| https://www.business-ink.com/spilled-ink?utm_source=facebook&utm_medium=social& |
| https://www.business-ink.com/spilled-ink?utm_source=mailchimp&utm_medium=email& |
| https://www.business-ink.com/spilled-ink?utm_source=google&utm_medium=cpc& |
Finally, add your campaign parameter |
| https://www.business-ink.com/spilled-ink?utm_source=facebook&utm_medium=social&utm_campaign=spilled-ink |
| https://www.business-ink.com/spilled-ink?utm_source=mailchimp&utm_medium=email&utm_campaign=spilled-ink |
| https://www.business-ink.com/spilled-ink?utm_source=google&utm_medium=cpc&utm_campaign=spilled-ink |
Optionally, add your content or term parameters |
| https://www.business-ink.com/spilled-ink?utm_source=facebook&utm_medium=social&utm_campaign=spilled-ink |
| https://www.business-ink.com/spilled-ink?utm_source=mailchimp&utm_medium=email&utm_campaign=spilled-ink&utm_content=cta-button |
| https://www.business-ink.com/spilled-ink?utm_source=google&utm_medium=cpc&utm_campaign=spilled-ink&utm_term=bulk printer ink |
Viewing Campaign Data
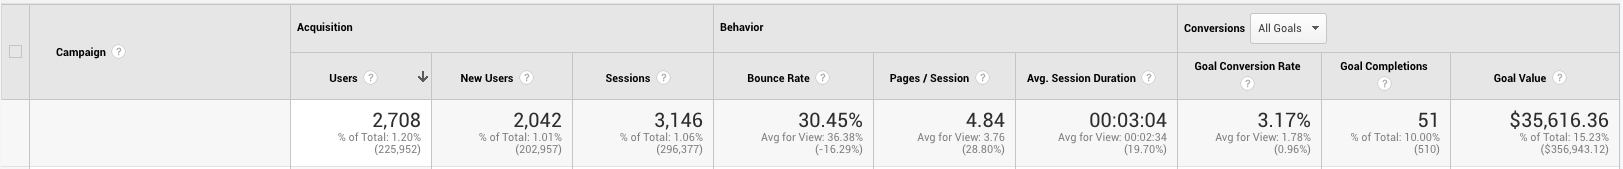
What do you do with this data?
Collecting data just to collect it has no value. You need to use it to make actionable decisions!
Once your campaign is over, review this data. Write a short paragraph for each column answering these questions:
- "Why do we think this metric turned out this way?
- "What can we do to try and improve it?"
- "What do we think will happen?"
- "Why do we think that will be the case?"
This exercise helps you form a hypothesis, the core of A/B testing and Conversion Rate Optimization. You look at the data and then write a hypothesis as an if/then statement:
If variable then expected result because of rationale.
The answer to question #2 becomes your variable, question #3 is your expected result, and question #4 is your rationale. Question #1 helps you put the hypothesis in context.
Example Hypothesis
Let's say you finished your campaign and see that most people that opened your email clicked on something in it, but they went to a site other than your landing page. You review the email template and realize that there are many links to other sites above your call to action button.
People must be clicking to your homepage, or to your social profiles before they see the call to action button! So you form a hypothesis:
If we move the link in the email to the top then more people will visit the landing page because everyone will see it first.
Now you've collected data and made use of it. That's the value in analytics.
Look for our guide on A/B Testing, coming soon!


